
What are the top economies in the world and how have these top economy rankings changed over time? There are more than a few economic history enthusiasts on the Madison Trust team, so we decided to create a chart showcasing the top ten biggest economies in the world, every five years, since 1960. By visualizing the largest economies in the world throughout history, we can see how historical events have influenced the ebb and flow of the world economy over time. Not only will you gain insights into the economic history of the United States, you will learn more about the economic history of the world and other countries that have vied for a place among the top 10 economies. How did World War II affect the global economy? What about the pandemic? Let’s find out!
What Does “GDP (Nominal)” Mean?
What does GDP mean? GDP stands for gross domestic product. According to the U.S. Bureau of Economic Analysis, gross domestic product is the total value of the final goods and services produced by a region. Tracking this number is an important way for people to gauge how an economy is performing. As the United States is the country with the highest GDP, it is often observed as an economic barometer for the world as a whole. “Nominal” or “current-dollar” GDP estimates are based on the market prices during the period measured, so they provide a more accurate representation of the economy. For example, nominal GDP data is seasonally adjusted to account for winter weather, holidays, and factory production schedules.
What Is the Biggest Economy in the World?
The United States is the largest economy in the world by far, encompassing about 15.5% of the world’s total GDP. According to the International Monetary Fund, America’s GDP has reached around 28 trillion dollars as of April 2024! Of course, population plays a role in a country’s total output. So what is America’s GDP per capita? The United States’ GDP per capita is 85.37 thousand dollars. Despite these bewilderingly high numbers, the United States’ account balance is actually 732.648 billion U.S. dollars in the red. That’s right: -732.648 billion. Fortunately, this seems to be trending downwards overall since 1980.
What Are the 10 Largest Economies in the World?
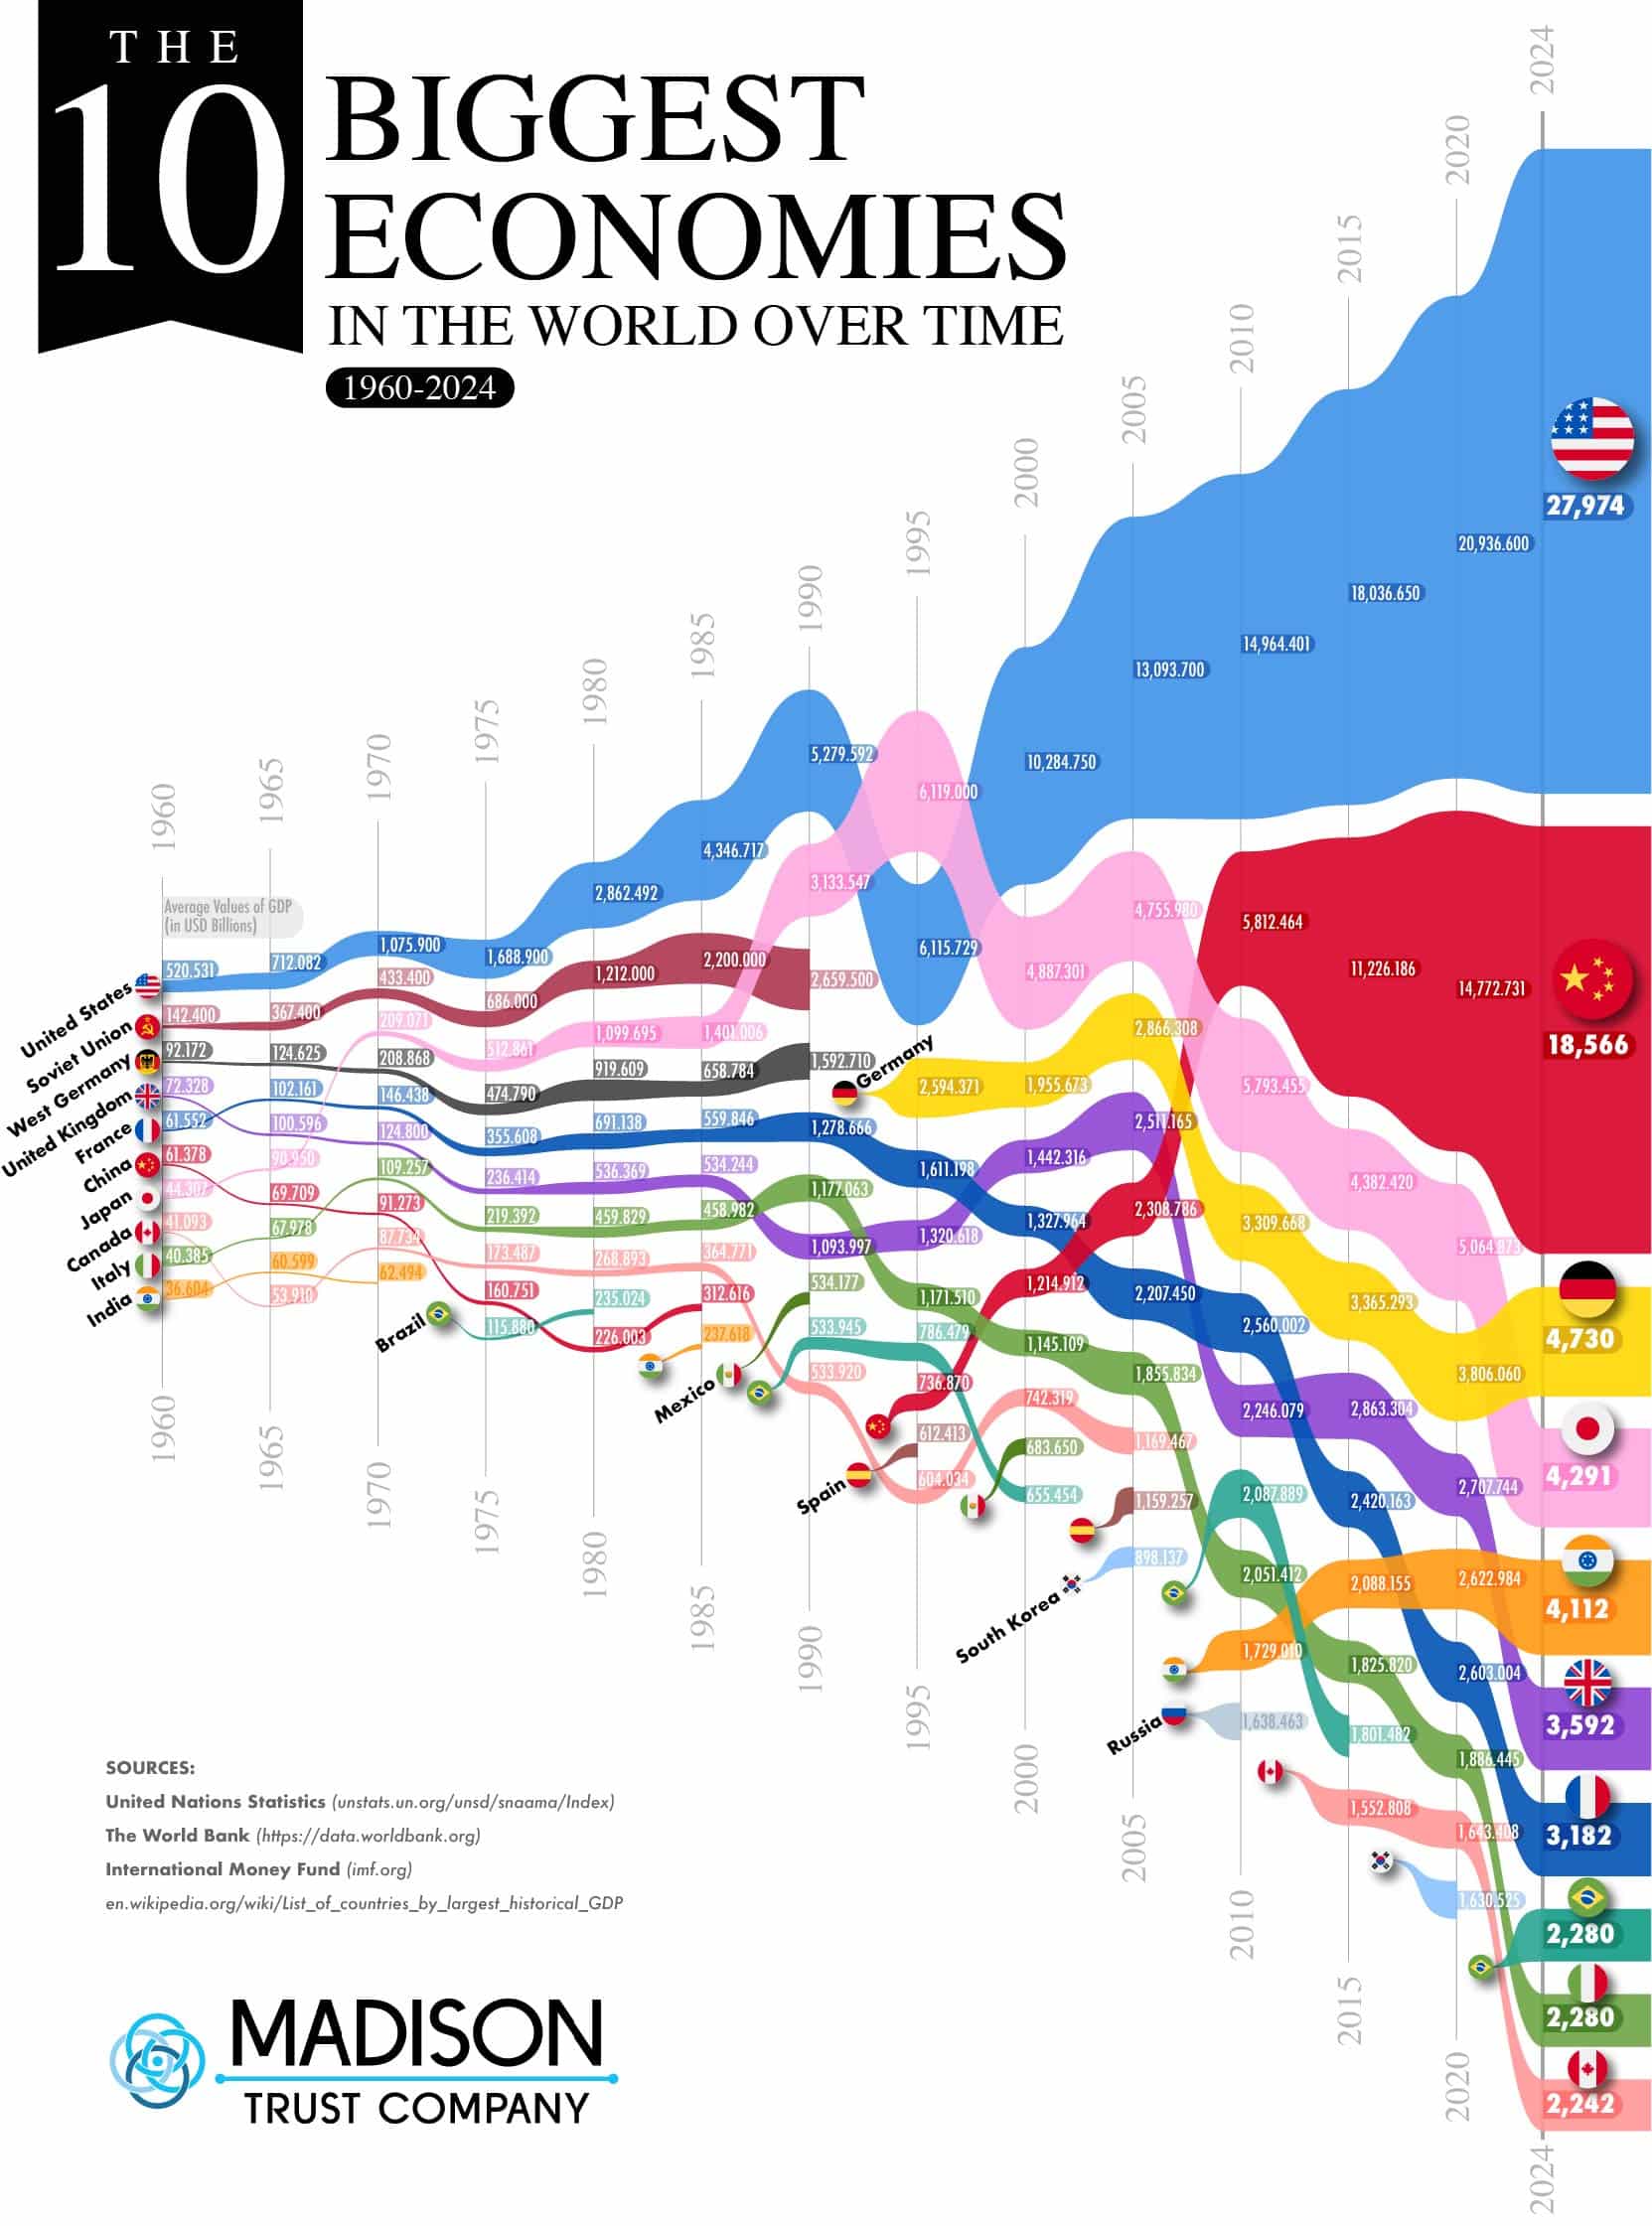
Here are the 10 biggest economies in the world ranked by GDP (2024 estimates) from the International Monetary Fund:
- United States GDP – 27,974 billion (USD)
- China GDP – 18,566 billion (USD)
- Germany GDP – 4,730 billion (USD)
- Japan GDP – 4,291 billion (USD)
- India GDP – 4,112 billion (USD)
- United Kingdom GDP – 3,592 billion (USD)
- France GDP – 3,182 billion (USD)
- Italy GDP – 2,280 billion (USD)
- Brazil GDP – 2,272 billion (USD)
- Canada GDP – 2,224 billion (USD)
When Did the U.S. Become The Strongest Economy in the World?
Following the Civil War, the United States’ economy truly began burgeoning into the colossal superpower it is today. Between 1865 and 1898, coal production increased by 800 percent and railway track miles by 557 percent. By the mid 1880s, America had exceeded Britain as the world’s top producer of steel and manufactured goods. By 1890, the United States had achieved the world’s most productive economy by far, yet it continued to adhere to principles of liberal nationalism (and avoiding foreign affairs). The United States Office of the Historian refers to 1898 as “The Birth of a Superpower.” This is when the U.S. provided support for the independence of Cuba, enmeshing itself in a struggle with Spain. By the culmination of this conflict, America was suddenly responsible for several colonies, heralding a new era of power and economic influence.
Which Country Had the Strongest Economy After WWII?
This chart explores historical GDP by country, so let’s delve a bit into economic history around the world. World War II spanned 1939 to 1945. Following the war, a broad period of global economic expansion known as the postwar economic boom, or the Golden Age of Capitalism, emerged. The United States, the Soviet Union, and many Western European and East Asian countries experienced unprecedented and sustained growth along with a profound uptick in employment rates. Contrary to initial predictions, many countries that had been devastated during the war underwent a surge of growth, including Japan (the Japanese Economic Miracle), West Germany and Austria (Wirtschaftswunder), South Korea (Miracle on the Han River), and France (Les Trente Glorieuses). Lots of unexpected miracles all around! After years of fear and wartime rationing, American consumers were eager to spend money. Postwar U.S. industries transitioned from wartime to peacetime production with more ease and success than expected. Many returning veterans were given government loans and other resources that enabled them to purchase homes and pursue education. These factors united to create a wave of prosperity in America. Gross national product, which measures all goods and services produced, skyrocketed to $300 billion by 1950, a growth of $100 billion in just 10 years. By 1960, it reached $500 billion, firmly solidifying America as the wealthiest nation in the world.
But What About Your Wealth?
Grow your savings and prepare for retirement with a self-directed IRA or alternative assets such as real estate or even startup companies!
The Complete List of the Biggest Economies by GDP Over Time (1960-2024)
By Average Values of GDP (in USD Billions)
|
Year/Rank |
1 |
2 |
3 |
4 |
5 |
6 |
7 |
8 |
9 |
10 |
|
1960 |
United States 520.531 |
Soviet Union
|
West Germany
|
United Kingdom
|
France
|
China
|
Japan
|
Canada
|
Italy
|
India
|
|
1965 |
United States
|
Soviet Union
|
West Germany
|
France
|
United Kingdom
|
Japan
|
China
|
Italy
|
India
|
Canada
|
|
1970 |
United States
|
Soviet Union
|
Japan
|
West Germany
|
France
|
United Kingdom
|
Italy
|
China
|
Canada
|
India
|
|
1975 |
United States
|
Soviet Union
|
Japan
|
West Germany
|
France
|
United Kingdom
|
Italy
|
Canada
|
China
|
Brazil
|
|
1980 |
United States
|
Soviet Union
|
Japan
|
West Germany
|
France
|
United Kingdom
|
Italy
|
Canada
|
Brazil
|
China |
|
1985 |
United States
|
Soviet Union
|
Japan
|
West Germany
|
France
|
United Kingdom
|
Italy
|
Canada
|
China
|
India
|
|
1990 |
United States
|
Japan
|
Soviet Union
|
West Germany
|
France
|
Italy
|
United Kingdom
|
Mexico
|
Brazil
|
Canada
|
|
1995 |
Japan
|
United States
|
Germany
|
France
|
United Kingdom
|
Italy
|
Brazil
|
China
|
Spain
|
Canada
|
|
2000 |
United States
|
Japan
|
Germany
|
United Kingdom
|
France
|
China
|
Italy
|
Canada
|
Mexico
|
Brazil
|
|
2005 |
United States
|
Japan
|
Germany
|
United Kingdom
|
China
|
France
|
Italy
|
Canada
|
Spain
|
South Korea
|
|
2010 |
United States
|
China
|
Japan
|
Germany
|
France
|
United Kingdom
|
Brazil
|
Italy
|
India
|
Russia
|
|
2015 |
United States
|
China
|
Japan
|
Germany
|
United Kingdom
|
France
|
India
|
Italy
|
Brazil
|
Canada
|
|
2020 |
United States
|
China
|
Japan |
Germany
|
United Kingdom
|
India
|
France |
Italy
|
Canada
|
South Korea
|
|
2024 |
United States 27,974 |
China 18,566 |
Germany 4,730 |
Japan 4,291 |
India 4,112 |
United Kingdom 3,592 |
France 3,182 |
Italy 2,280 |
Brazil 2,280 |
Canada 2,242 |
Sources:
United Nations Statistics (unstats.un.org/unsd/snaama/Index)
The World Bank (https://data.worldbank.org)
International Money Fund (imf.org)
en.wikipedia.org/wiki/List_of_countries_by_largest_historical_GDP
*2024 Data based on International Monetary Fund projections
Would you like to display this on your website? Copy and paste the code below!
<center>
<textarea readonly>
<a href="https://www.madisontrust.com/information-center/visualizations/the-10-biggest-economies-in-the-world-over-time-1960-2024/">
<img src="https://www.madisontrust.com/wp-content/uploads/2024/06/biggest-economies-world-over-time-5.jpg" alt="The 10 Biggest Economies in the World Over Time (1960-2024) - MadisonTrust.com IRA - Infographic" title="The 10 Biggest Economies in the World Over Time (1960-2024) - MadisonTrust.com - Infographic></a><br><a href="https://www.MadisonTrust.com" alt="MadisonTrust.com" title="MadisonTrust.com">By MadisonTrust.com</a>
</textarea>
</center>